Do you feel that no matter what you do, your SaaS churn rate doesn’t budge? It’s below average so there should be untapped potential in your customer base. But you seem to be unable to tap into it. Worse, your gut feeling keeps telling you that your business is fine and your customers are happy enough.
Your gut feeling can be right. Churn is such a tricky beast that you may be comparing apples to oranges.
Things may be other way around too. You may be proud of your negative churn rate, while missing the real need to improve churn.
After reading this post you’ll know where you stand. There are several things to check before comparing your churn rate to others’.
I’m using Softletter SaaS Report 2013 as a reference. It reports an average annual churn rate of 6-12% (0.5 – 1% monthly). You might also want to read Lincoln Murphy’s excellent article SaaS Churn Rate – What’s Acceptable? to get a good overview of the churn targets.
Who are these “average” guys?
Check that your company profile matches that of the study.
If you have a freemium SaaS for consumer audience then the Softletter SaaS Report is best used as a pee-paper for puppy dogs. Your cost structure, customer profile and even the preferred churn formula are different from companies in that study.
The SaaS companies in Softletter SaaS Report are mostly B2B companies. Most of them don’t offer freemiums and one third of them doesn’t even offer a free trial. These guys sell to business customers and over 50% of those customers opt for a yearly or even longer subscription. Huge amounts of energy and money are spent to find customers that stick, and almost 40% of these companies are not making any profit.
How is the average churn calculated?
This differs from study to study, but studies often use gross churn rate of annual revenue.
As we learned in the previous part of the Churn Guide, Churn is an outlaw metric – there is no standard way to calculate it. This means you cannot compare two churn rates unless they both were calculated in the same way.
If you are using a quality source, their definition of the churn will be included. Here’s what Softletter SaaS Report says:
“On a per annum basis, what is the revenue renewal rate of your SaaS customer base? As a simplified example, if you entered the year with 10 customers paying $1M, what were the revenues generated by those customers at year’s end? If the revenue generated was $1.1M, that represents a 110% renewal rate or 10% gain. If the number is $900k,that represents a 90% renewal rate (or a 10%revenue loss/churn).”
Don’t tailor your churn calculations to match the “average way” – match them to your needs
The churn rate that you calculate for comparing your company to others is not always the best churn rate to use for managing your business. In fact, you may end up calculating your churn several times, as different versions of churn are used for different purposes.
It’s not important that you calculate the “right” version of churn – you’ll want easily understandable, reliable and comparable metrics within your company. What ever way you choose, stick to it so you can compare your results over the years.
Customer Churn vs. Revenue Churn
All customers are not equal. Check that you are not comparing customer churn rate to revenue churn rate.
Customer churn rate tells you how fast your customer base is thinning. At 5% monthly customer churn rate, half of your customer base must be replaced with new customers in a year.
Revenue churn rate tells you how fast your revenue stream is running dry because the customers are leaving you.
You can compare customer churn rate to revenue churn rate only if all your customers spend the same amount of money. That is rarely the case.
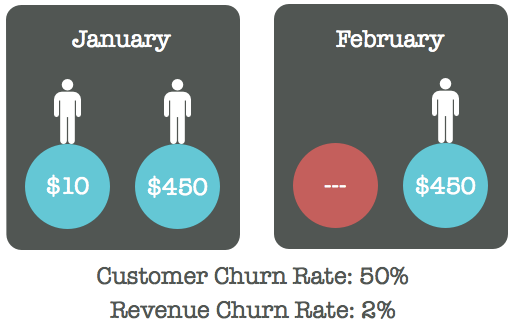
Often, the lowest-paying customers are the worst customers you can have. They don’t manage value-based thinking and they may have unrealistic expectations. They require extra support and yet they are the first to leave you on a whim.
On the other hand, your highest-paying customers are often businesses. They pay well and tend to be loyal.
Losing a business plan customer who pays you $450 per month is a bigger lost than losing a mini-plan customer who pays you $10 per month. In fact, it may be a wise business decision to let the poor customers leave you if the customers who generate 80% of your income are loyal.
Gross Churn vs. Net Churn
Check that you are not comparing net churn rate to gross churn rate.
Net Churn Rate tells you about changes in your customer base size/revenue.
Gross Churn Rate tells you about customer/revenue losses over time.
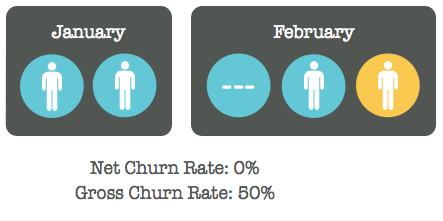
When you are calculating net churn rate, you’ll get to calculate in new customers (or their revenue). Knowing your overall situation is important, but it’s often more useful to follow your growth and losses separately.
Gross churn rate has different philosophy. You take a moment in time and ear-mark all the customers you have. Then you follow them through time and see what they do. When you are calculating gross churn, you’ll still get to calculate in upgrades and upsells, but only for the customers you are following.
Some studies, like Pacific Crest’s, don’t include upsells when calculating average churn rate, so check your source.
Churn time-frame
Check that you are not comparing monthly churn x 12 to annual churn. You really should calculate annual churn separately as your churn may vary seasonally. Also, just multiplying by 12 will give you incorrect results when your churn is high.
How to convert monthly churn to annual churn correctly?
Annual Churn Rate = 1 – (1 – Monthly Churn Rate)^12
Check out Joel’s churn tip #7 for more info.
“Should I try to reach the average churn rate?”
You definitely should follow up your SaaS churn, and eventually you’ll want to put some real effort into improving it. But is that time now? In my opinion, blindly trying reach average or recommended churn is a surefire way to make yourself miserable.
If you find a good study on similar companies than yours, the average churn visualizes the potential that your customer base has. But you may be nicely profitable even if you wouldn’t tap to all that potential.
It all comes down to knowing what’s best for your business and identifying the easiest ways to increase your profits. You have already looked at the SaaS Compass, right?
In Softletter SaaS Report the fastest growing businesses were not identified as the ones having the least churn. The fastest growing businesses were the ones who had snipped their customer acquisition costs to the minimum and were able to run masses of customers into their product.
PS. Yes, I recall promising to talk about cohorts, segments and all that jazz… but I changed my plans. Maybe we’ll get to that next time. If you want to make sure you are not missing out, drop your name to the box below.
You’ll get my articles delivered straight to your inbox.
The post Does Average Churn Rate Feel Out of Reach? appeared first on Happy Bootstrapper.