“What metrics should I track?” and “How do I get started with SaaS metrics?” are the most common questions people ask me.
SaaS Metrics for Hackers is a 3-part article series that helps you get started with SaaS metrics and finances.
The first part explained the financial basics, this part explains how to use the SaaS metrics to debug your finances, and the third part explains how to use funnels & user events to debug your SaaS metrics.
Use SaaS Metrics to debug your finances
Whenever financial metrics are not as well as you’d like, you can use the SaaS metrics to find out where the problem is. 
You can compare your SaaS metrics from month to month, and you’ll find out if your problems are in traffic, conversions or in retaining the customers.
After the SaaS metrics tell you where to look at, you can take a deep dive into the user events and funnels and see what you could do better.
The line between financial metrics, SaaS metrics and funnels & user events isn’t a clear one. But if you don’t prioritize, you’ll have troubles managing your data – there’s just so much of it.
The good news is that most SaaS & financial metrics aren’t real-time metrics (think Monthly Recurring Revenue, not Daily Recurring Revenue) . It’s enough to check out these metrics once per month. It’s a huge temptation to follow all metrics in real-time, but there’s no added benefit in that.
The main SaaS business funnel
SaaS metrics help you understand how the people/customers flow through your money-making system.
They measure things per unit – the unit being your customer (or group of customers). “Customer metrics” or “customer lifecycle metrics” would be a fine name for them too.
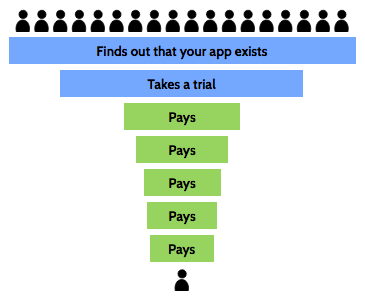
A lot of people are reached by your marketing efforts. With time, part of those people becomes your customers – and eventually they leave your business.
The flow of people creates a “funnel” – and the wider you can keep the funnel, the more revenue you’ll get.

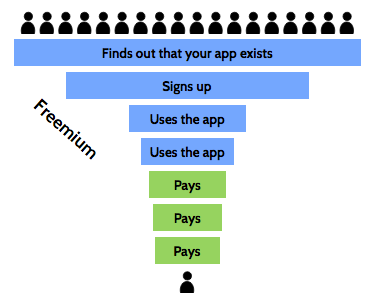
Situation is a bit different if you are on freemium model.
 The flow is similar in freemium, but it’s a bit harder to analyze as people move through the funnel at their own speed.
Follow the SaaS main funnel conversion rates
To know that the funnel stays as wide and long as possible, you’ll want to measure the conversion rates from step to another.
Conversion rate is a general term for the proportion of people who took a wanted action.
When we talk about SaaS business, conversion rate (CR) refers to the amount of site visitors who bought a subscription.
For example, if 2 of your 100 visitors bought a subscription, your conversion rate would be 2%. If you want to think that from unit metric perspective – when a visitor comes to your site, there’s a 2% possibility that she ends up becoming your customer.
I advice measuring the CR, but also the other conversion rates throughout the main funnel. You can see them in the image below.
 Retention rate is the proportion of customers you were able to retain, while the churn rate is the proportion of people you lost. If, for example your monthly retention rate was 98%, then your churn rate was 2%.
With freemium, following the conversion rates through the funnel isn’t as straightforward – it may take several months before the freemium customer is ready to buy. You need to start using cohorts (follow up the same people through time) earlier.
How to measure the funnel?
To calculate the conversion rates, you’ll need to know the amount of people in different steps.
The easiest way is to use an analytics tools that support funnels, like Kissmetrics or Mixpanel. But as these are major events, you can get started by collecting them yourself (without clogging your DB).
You will eventually grow out of your own system though – unless you match the Urchin Tracking Module (UTM) parameters to your user accounts/events.
When you have the UTM parameters, you can segment your metrics by traffic source, marketing campaign or A/B test. But if you haven’t linked the traffic source information (from the UTM parameters) to your customer emails/ids, you can’t track where they came from.
Kissmetrics documentation has a good explanation on UTM parameters and how they handle them.
When to use segments & cohorts?
Segments organize your data by its type. E.g. people who came via Twitter, people who subscribed to enterprise plan.
Cohorts organize your data in time. E.g. people who signed up in January.
Eventually, having your data organized by monthly cohorts and by plans would be superb.
But there’s just one thing to look out for when you are starting out – the conversion rates are percentages. You can’t rely on percentages until you have about 100 people in each step.
To go around this problem, you can start by calculating the funnel conversion rates for your whole customer base.
When you have enough customers, your first cohort can be e.g. people who signed up in the last 6 months. Your first segments can be your most popular plan and all the others grouped together.
Keep it simple. The most important thing is to always make sure that you understand all the metrics that you follow.
What are good values?
Mostly compare your values to your own values in previous months. Try to use percentage-based metrics in comparison.
For (MRR) churn rate, 3-7% per month is what small SaaS companies often have. It’s bigger than recommended 1-2%, but it’s not productive to try to reach the churn rates that large high-touch businesses can maintain.
This Totango study can also give you some ideas of good rates, but don’t stick to it too much. For example, read Brennan’s story on an experiment that should have brought the conversion rates up, but didn’t.
What about CLTV & CAC?
Cross-funnel SaaS metrics like customer acquisition cost (CAC) and customer lifetime value (CLTV, LTV or CLV) are important, but they aren’t the right metrics for a new SaaS.
I love CAC, but calculating it from the start is just depressing – even when you don’t use paid marketing. Yes, do sum up all the hours that you spent on marketing and trial customer support and put a rate on your hours… but don’t calculate the CAC yet. Wait until you have some mass in your customer base to carry the cost.
When you start out, you also don’t have stable churn figures because you don’t have enough customers. You don’t know the annual churn fluctuations yet. And no churn means no forward-looking CLTV.
You can already start measuring the simple historic CLTV (how much a single/average customer paid you – total). But for even that you’ll need to wait until the customers churn.
Fortunately, you are following the monthly costs and revenue. If you invest in something, you can easily calculate how many months it will take until you can get your money back. That will get you started until CAC & CLTV become accessible for you.
If you don’t want to miss the next part in this article series, drop your email to the box below:
The post SaaS Metrics for Hackers – The SaaS Main Funnel appeared first on Happy Bootstrapper.
